Normalized Difference Bare ice Index, NDBI
//VERSION=3

// Normalized Difference Bare ice Index, NDBI
// Source: https://www.mdpi.com/2072-4292/11/19/2280
// Values between 0 and 0.2 correspond to snow
// Values between 0.2 and 0.5 correspond to bare ice
// Values between 0.5 and 0.8 correspond to dark (melting) ice
// Thresholds may be adapted depending on local conditions.

function setup() {
  return {
    input: ["B02", "B21"],
    output: { bands: 3 }
  };
}

function evaluatePixel(sample) {

  // Calculate NDBI
  var NDBI = index(sample.B02, sample.B21);

  // Color depending on class
  if ((NDBI > 0) & (NDBI < 0.2)){
    return [179/255, 203/255, 255/255]; // Snow
  } else if ((NDBI >= 0.2) & (NDBI < 0.5)){
    return [255/255,204/255,204/255]; // Ice
  } else if ((NDBI >= 0.5)&(NDBI < 0.8)){
    return [0/255,0/255,255/255]; // Dark ice
  } else {
      return [0,0,0]; // Shadows, water...
  }
}Evaluate and Visualize
General description of the script
The Sentinel-3 OLCI Normalized Difference Bare ice Index (NDBI) was developed by Kokhanovsky et al. (2020) to differentiate snow-covered surfaces from bare ice. NDBI used two bands: one in the Blue (Band 2, 412.5 nm) and one in the NIR (Band 21, 1020 nm).
Formula: (Band 02 - Band 21) / (Band 02 + Band 21)
The surface types corresponding to NDBI values are shown in the table below. The thresholds may be modified depending on local conditions.
| Values | Surface |
|---|---|
| 0–0.2 | Snow |
| 0.2–0.5 | Bare ice |
| 0.5–0.8 | Dark ice (melting) |
Description of representative images
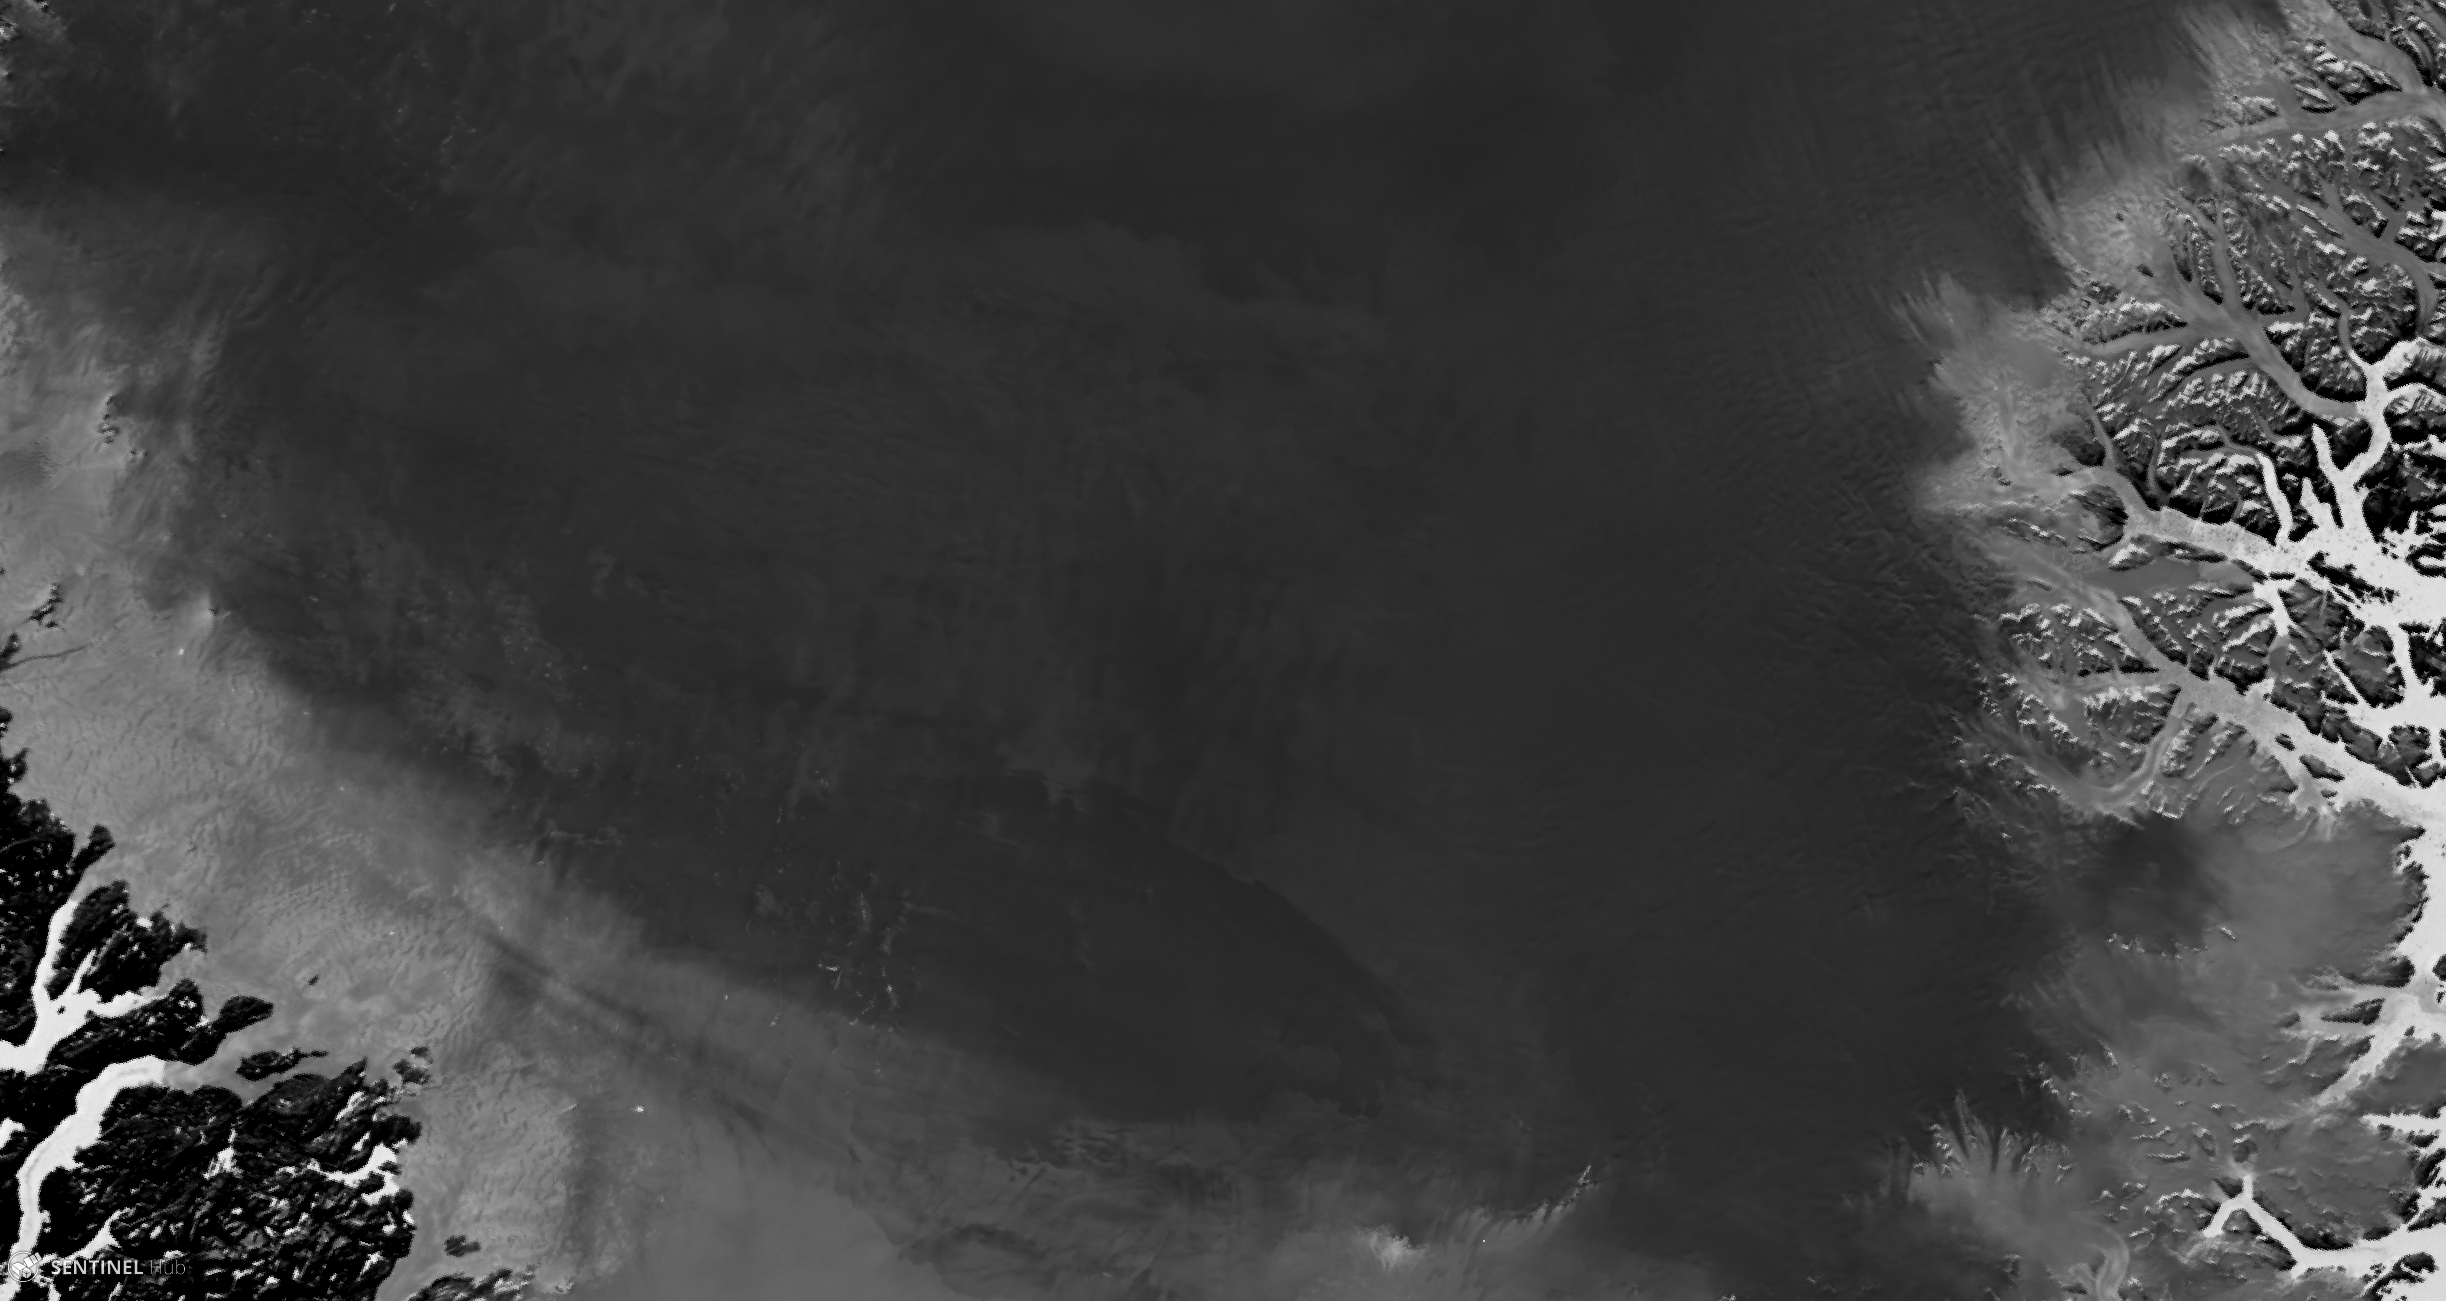
- NDBI of South Greenland, acquired on 29 August 2019.
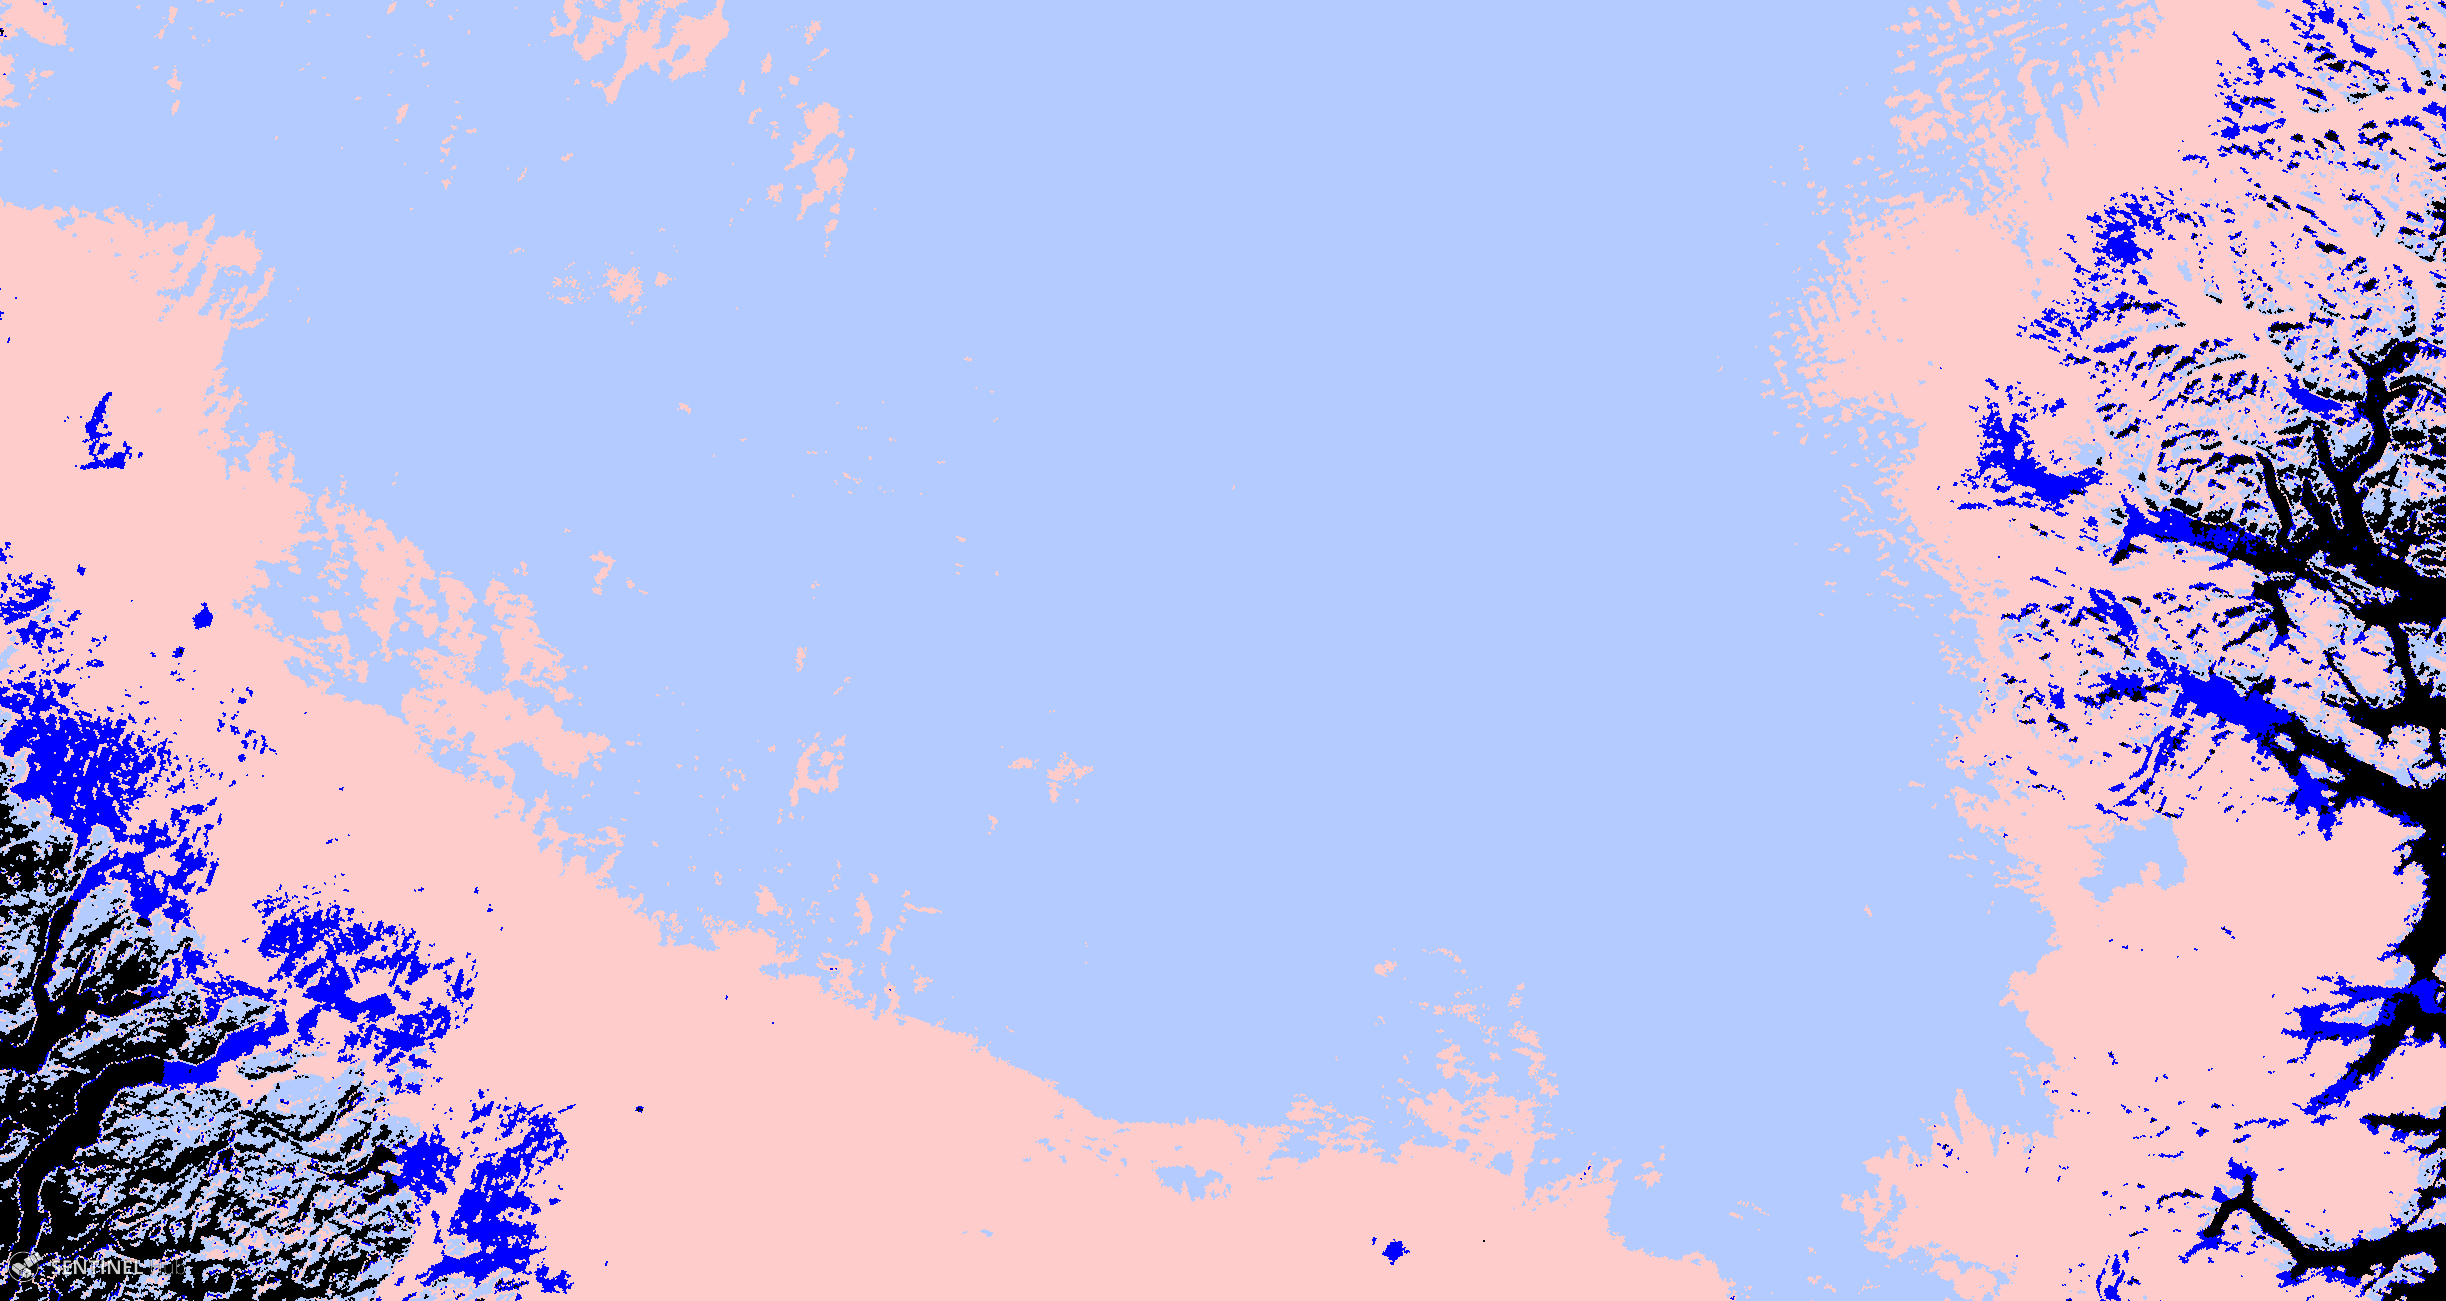
- Classified NDBI map of South Greenland, acquired on 29 August 2019 (Light blue = snow, pink = ice, dark blue = dark ice, black = other surfaces).
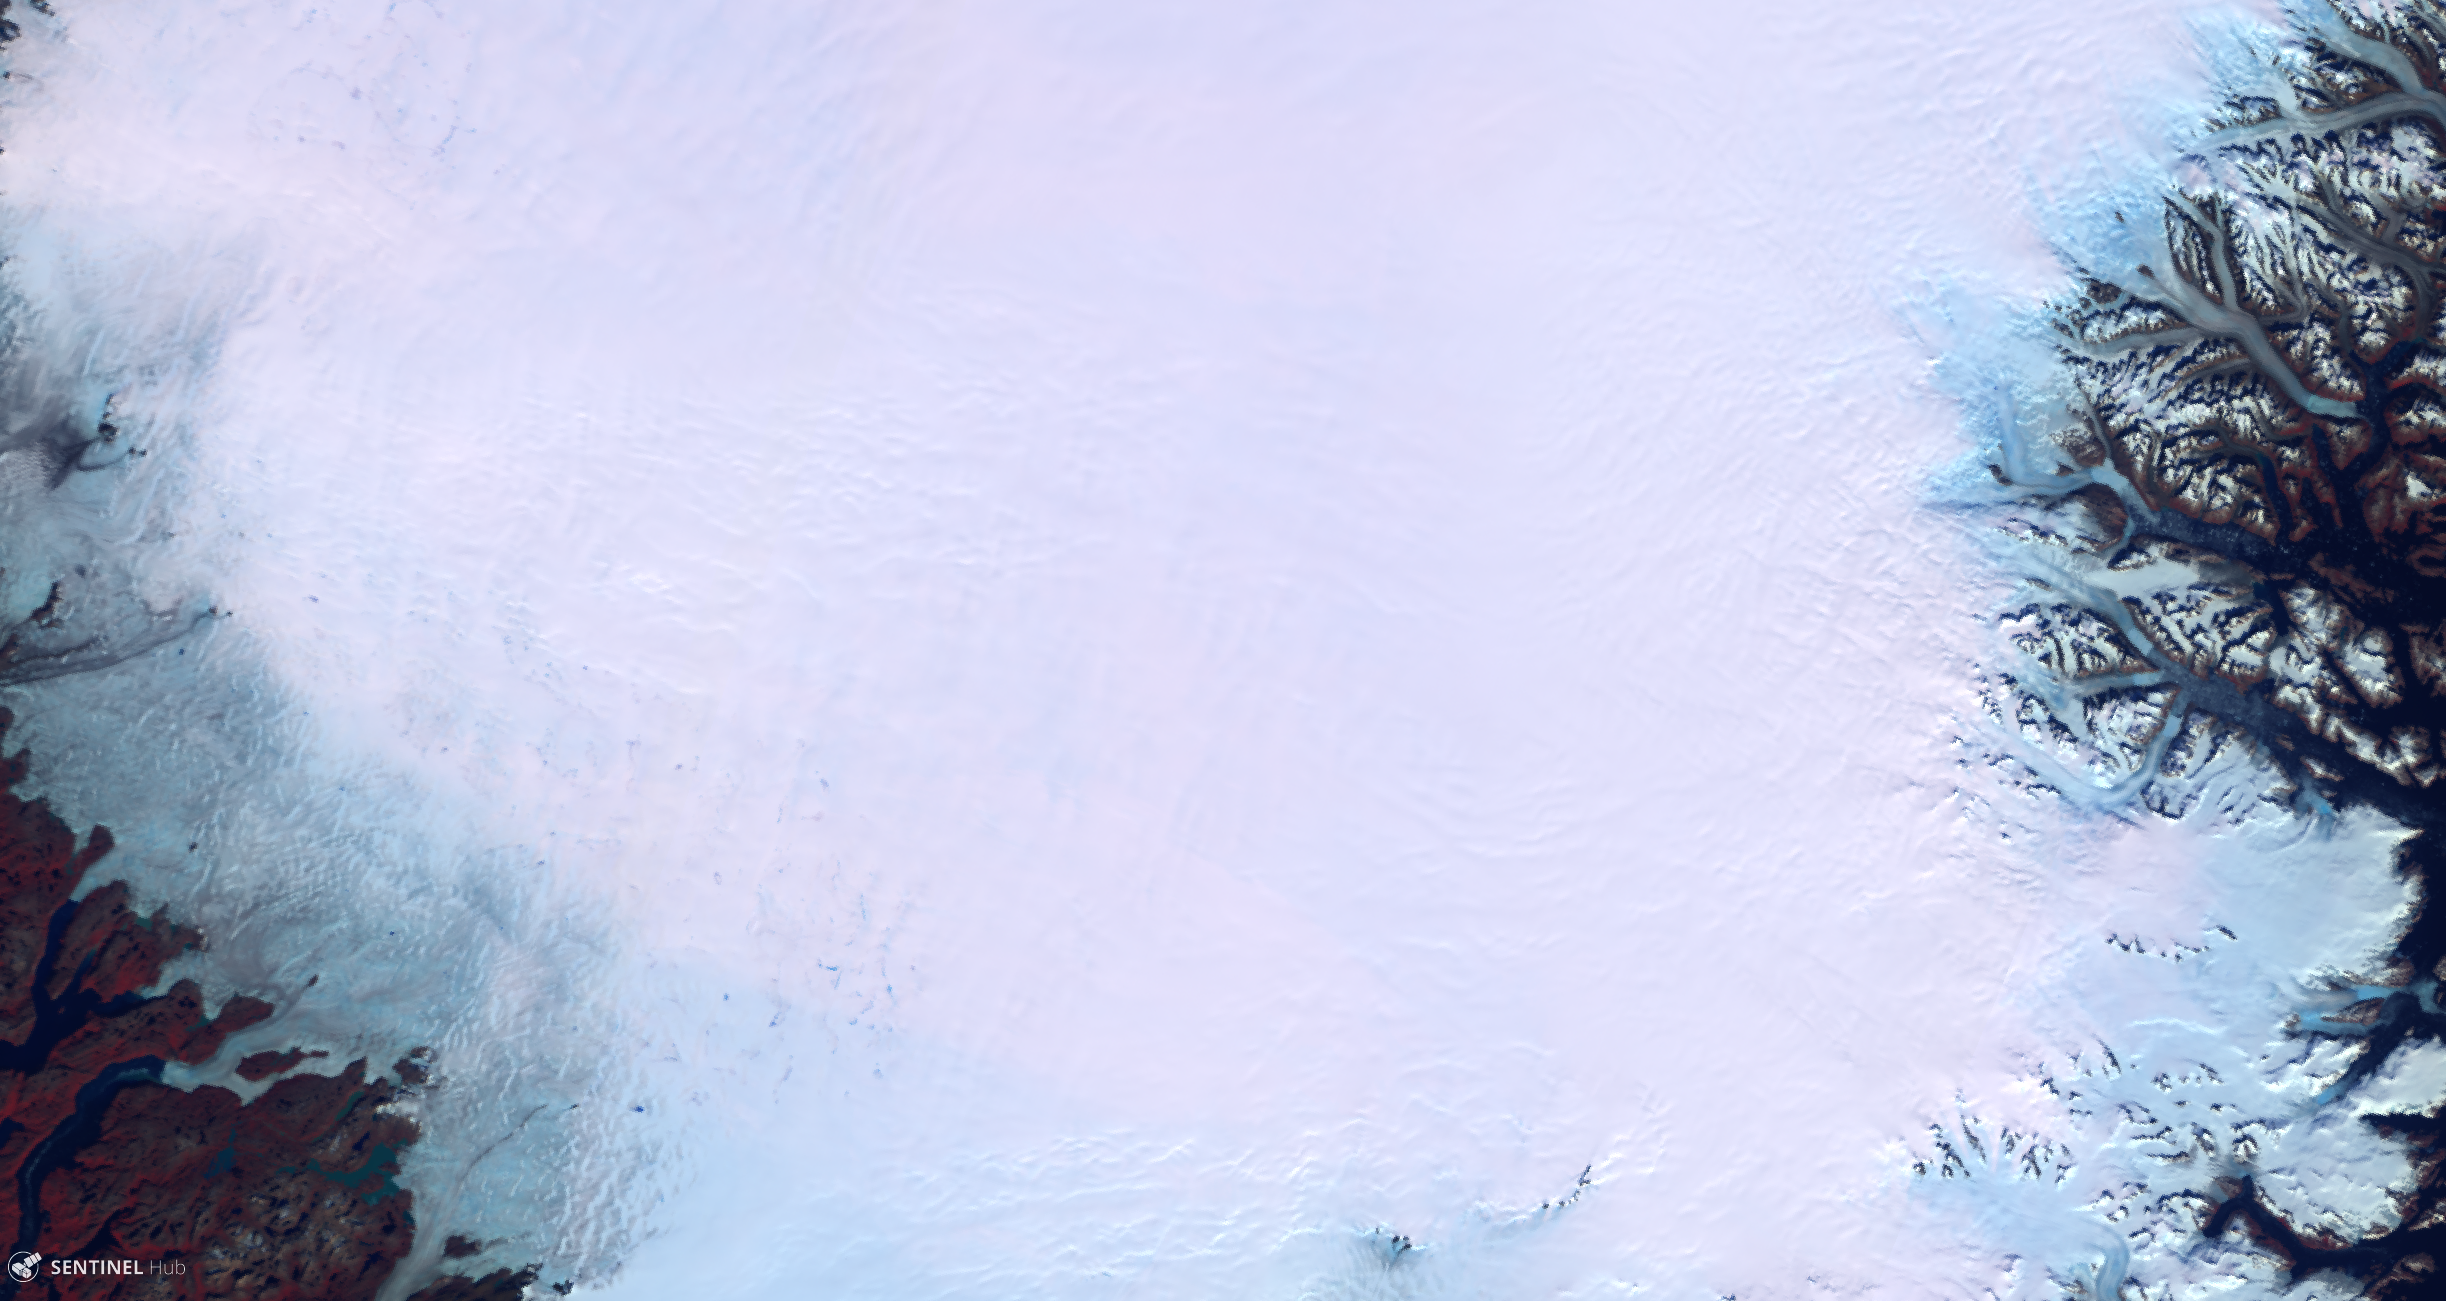
- For comparison purposes: RGB (B17, B07, B03) image of South Greenland, acquired on 29 August 2019.)
Contributors:
Maxim Lamare