Normalized difference vegetation index with uncertainty
function clamp (a) {
  return a<0 ? 0 : a > 1 ? 1 : a;
}
function sigNDVI (b4, s4, b8, s8) {
  var sum = b8 + b4;
  var ndvi = (b8 - b4)/sum;
  var s_ndvi = 2 / (sum*sum) *
      Math.sqrt(b8*b8*s4*s4+b4*b4*s8*s8);
  var darkness = clamp(1-2*s_ndvi);
  return [
    0.9*clamp(1-ndvi)*darkness,
    0.8*clamp(ndvi)*darkness,
    0.1*darkness];
}
return sigNDVI(B04, 0.02, B08, 0.03);Evaluate and Visualize
Basic information
- Bands used to calculate NDVI index: B4, B8
- Bands used by the script: B2, B3, B4, B8
General description
This script allows you to visually interpret how the normalized density vegetation index (NDVI) [1] is affected by the uncertainties in detector reflectances of the L1C products.
Since NDVI is defined as a ratio of difference over sum of bands 8 and 4 (near infrared and red):
\(NDVI := \mathtt{Index}(B8,B4) = \frac{B8-B4}{B8+B4}.\)
the uncertainty propagation [3] gives us the uncertainty of the index itself as
\(\Delta_{NDVI} := \frac{\sqrt{B8^2 \Delta_{B4}^2 + B4^2 \Delta_{B8}^2 - 2B4 B8 \Delta_{B4B8}}}{(B8+B4)^2}\).
where $\Delta_{B4}$ and $\Delta_{B8}$ are uncertainties of red and near infrared bands respectively (reported by ESA to be 0.02 and 0.03). We left out the mixed part $\Delta_{B4B8}$ as if the two uncertainties were not correlated.
The script encodes the uncertainty with darkness, as can be seen in following figure [2]
![Color map of the NDVI uncertainty script from [2][1]](/custom-scripts/sentinel-2/ndvi_uncertainty/fig/cmap.jpg)
Description of representative images
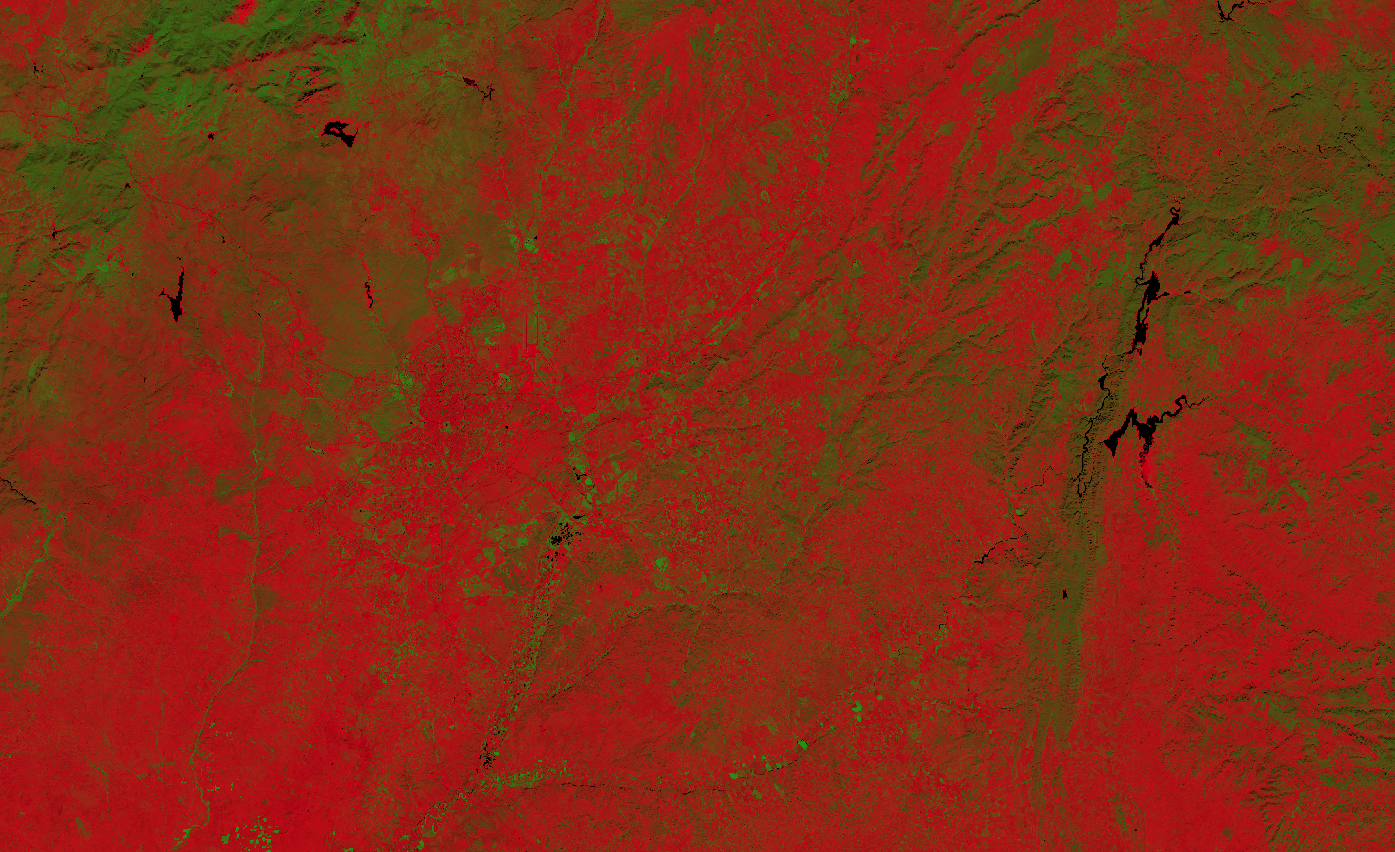
NDVI with uncertainty of Madrid. Acquired on 10.26.2019.
References
[1] Wikipedia, Normalized Difference Vegetation Index . Accessed on October 4th 2017.
[2] Sentinel-Hub, Ad hoc testing of algorithms globally. Accessed October 10th 2017.
[3] Wikipedia, Propagation of uncertainty. Accessed October 10th 2017.