Normalized difference vegetation index
//VERSION=3
function setup() {
   return {
      input: ["B04", "B08", "dataMask"],
      output: { bands: 4 }
   };
}

const ramp = [
   [-0.5, 0x0c0c0c],
   [-0.2, 0xbfbfbf],
   [-0.1, 0xdbdbdb],
   [0, 0xeaeaea],
   [0.025, 0xfff9cc],
   [0.05, 0xede8b5],
   [0.075, 0xddd89b],
   [0.1, 0xccc682],
   [0.125, 0xbcb76b],
   [0.15, 0xafc160],
   [0.175, 0xa3cc59],
   [0.2, 0x91bf51],
   [0.25, 0x7fb247],
   [0.3, 0x70a33f],
   [0.35, 0x609635],
   [0.4, 0x4f892d],
   [0.45, 0x3f7c23],
   [0.5, 0x306d1c],
   [0.55, 0x216011],
   [0.6, 0x0f540a],
   [1, 0x004400],
];

const visualizer = new ColorRampVisualizer(ramp);

function evaluatePixel(samples) {
   let ndvi = index(samples.B08, samples.B04);
   let imgVals = visualizer.process(ndvi);
   return imgVals.concat(samples.dataMask)
}
//VERSION=3
function setup() {
return {
input: ["B03", "B04", "B08", "dataMask"],
output: [
{ id: "default", bands: 4 },
{ id: "index", bands: 1, sampleType: "FLOAT32" },
{ id: "eobrowserStats", bands: 2, sampleType: 'FLOAT32' },
{ id: "dataMask", bands: 1 }
]
};
}
const ramp = [
[-0.5, 0x0c0c0c],
[-0.2, 0xbfbfbf],
[-0.1, 0xdbdbdb],
[0, 0xeaeaea],
[0.025, 0xfff9cc],
[0.05, 0xede8b5],
[0.075, 0xddd89b],
[0.1, 0xccc682],
[0.125, 0xbcb76b],
[0.15, 0xafc160],
[0.175, 0xa3cc59],
[0.2, 0x91bf51],
[0.25, 0x7fb247],
[0.3, 0x70a33f],
[0.35, 0x609635],
[0.4, 0x4f892d],
[0.45, 0x3f7c23],
[0.5, 0x306d1c],
[0.55, 0x216011],
[0.6, 0x0f540a],
[1, 0x004400],
];
const visualizer = new ColorRampVisualizer(ramp);
function evaluatePixel(samples) {
let val = index(samples.B08, samples.B04);
// The library for tiffs works well only if there is only one channel returned.
// So we encode the "no data" as NaN here and ignore NaNs on frontend.
const indexVal = samples.dataMask === 1 ? val : NaN;
const imgVals = visualizer.process(val);
return {
default: imgVals.concat(samples.dataMask),
index: [indexVal],
eobrowserStats: [val, isCloud(samples) ? 1 : 0],
dataMask: [samples.dataMask]
};
}
function isCloud(samples) {
const NGDR = index(samples.B03, samples.B04);
const bRatio = (samples.B03 - 0.175) / (0.39 - 0.175);
return bRatio > 1 || (bRatio > 0 && NGDR > 0);
}//VERSION=3
function setup() {
return {
input: ["B04", "B08"],
output: {
bands: 1,
sampleType: "FLOAT32"
}
};
}
function evaluatePixel(samples) {
return [index(samples.B08, samples.B04)]
}Evaluate and Visualize
General description
The well known and widely used NDVI is a simple, but effective index for quantifying green vegetation. It normalizes green leaf scattering in Near Infra-red wavelengths with chlorophyll absorption in red wavelengths.
The value range of the NDVI is -1 to 1. Negative values of NDVI (values approaching -1) correspond to water. Values close to zero (-0.1 to 0.1) generally correspond to barren areas of rock, sand, or snow. Low, positive values represent shrub and grassland (approximately 0.2 to 0.4), while high values indicate temperate and tropical rainforests (values approaching 1). It is a good proxy for live green vegetation; see [1] for details.
The normalized difference vegetation index, abbreviated NDVI, is defined as
\[NDVI := \mathtt{Index}(NIR,RED) = \frac{NIR-RED}{NIR+RED}.\]For Sentinel-2, the index looks like this:
\[NDVI := \mathtt{Index}(B8,B4) = \frac{B8-B4}{B8+B4}.\]NDVI for other datasets:
Landsat 8 NDVI = (B05 - B04) / (B05 + B04)
Landsat 5 and 7 NDVI = (B04 - B03) / (B04 + B03)
ENVISAT MERIS NDVI = (B13 - B07) / (B13 + B07)
Landsat 1-5 MSS NDVI = (B04 - B02) / (B04 + B02)
Landsat 4-5 TM = (B04 - B03) / (B04 + B03)
Landsat 7 ETM+ NDVI = (B04 - B03) / (B04 + B03)
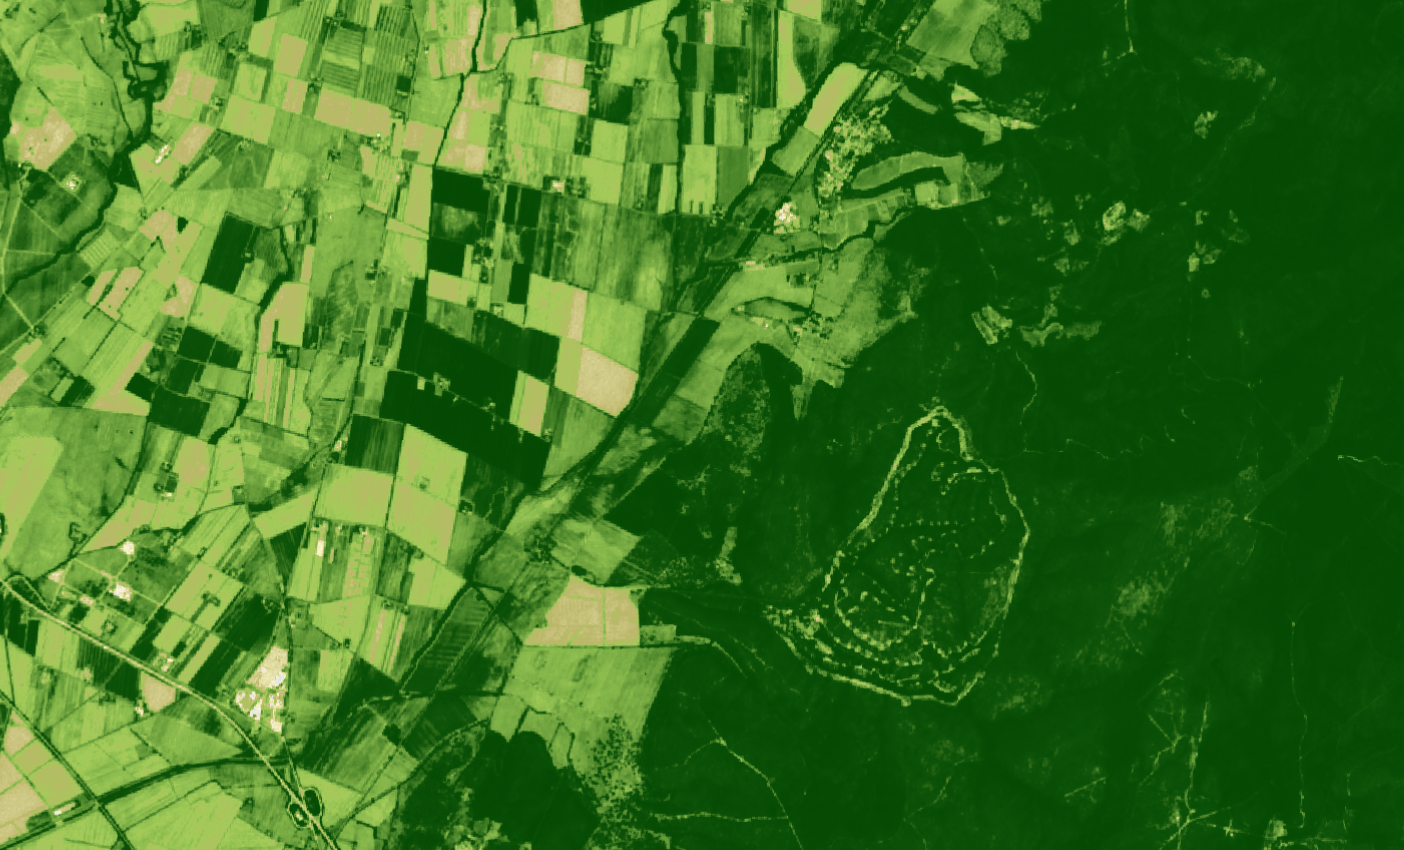
Description of representative images
NDVI of Rome. Acquired on 8.10.2017.
Color legend
| NDVI range | HTLM color code | Color |
|---|---|---|
| NDVI < -0.5 | #0c0c0c | |
| -0.5 < NDVI ≤ 0 | #eaeaea | |
| 0 < NDVI ≤ .1 | #ccc682 | |
| .1 < NDVI ≤ .2 | #91bf51 | |
| .2 < NDVI ≤ .3 | #70a33f | |
| .3 < NDVI ≤ .4 | #4f892d | |
| .4 < NDVI ≤ .5 | #306d1c | |
| .5 < NDVI ≤ .6 | #0f540a | |
| .6 < NDVI ≤ 1.0 | #004400 |
References
[1] Wikipedia, Normalized Difference Vegetation Index . Accessed on October 4th 2017.