Maximum Peak Height Bloom Index
// CyanoLakes Bloom Index
// Kravitz, J.A., Matthews, M.W., 2020

// Water body detection - Credit : Mohor Gartner
var MNDWI_threshold = 0.42; //testing shows recommended 0.42 for Sentinel-2 and Landsat 8. For the scene in article [1] it was 0.8.
var NDWI_threshold = 0.4; //testing shows recommended 0.4 for Sentinel-2 and Landsat 8. For the scene in article [1] it was 0.5.
var filter_UABS = true;
function wbi(r, g, b, nir, swir1, swir2) {
  //water surface
  let ws = 0;
  //try as it might fail for some pixel
  try {
    //calc indices
    //[4][5][1][8][2][3]
    var ndvi = (nir - r) / (nir + r),
      mndwi = (g - swir1) / (g + swir1),
      ndwi = (g - nir) / (g + nir),
      ndwi_leaves = (nir - swir1) / (nir + swir1),
      aweish = b + 2.5 * g - 1.5 * (nir + swir1) - 0.25 * swir2,
      aweinsh = 4 * (g - swir1) - (0.25 * nir + 2.75 * swir1);
    //[10][11][12]
    var dbsi = (swir1 - g) / (swir1 + g) - ndvi,
      wii = Math.pow(nir, 2) / r,
      wri = (g + r) / (nir + swir1),
      puwi = 5.83 * g - 6.57 * r - 30.32 * nir + 2.25,
      uwi = (g - 1.1 * r - 5.2 * nir + 0.4) / Math.abs(g - 1.1 * r - 5.2 * nir),
      usi = 0.25 * (g / r) - 0.57 * (nir / g) - 0.83 * (b / g) + 1;
    //DEFINE WB
    if (
      mndwi > MNDWI_threshold ||
      ndwi > NDWI_threshold ||
      aweinsh > 0.1879 ||
      aweish > 0.1112 ||
      ndvi < -0.2 ||
      ndwi_leaves > 1
    ) {
      ws = 1;
    }
    //filter urban areas [3] and bare soil [10]
    if (filter_UABS && ws == 1) {
      if (aweinsh <= -0.03 || dbsi > 0) {
        ws = 0;
      }
    }
  } catch (err) {
    ws = 0;
  }
  return ws;
}
let water = wbi(B04, B03, B02, B08, B11, B12);

// Baseline subtractions
function MCI(a, b, c) {
  return b - a - ((c - a) * (705 - 665)) / (740 - 665);
}
function FAI(a, b, c) {
  return b - a - ((c - a) * (740 - 665)) / (842 - 665);
}

// True color representation
var trueColor = [3 * B04, 3 * B03, 3 * B02];

// Switches to FAI if FAI > MCI
function Switch(a, b) {
  if (a > b) {
    return a;
  } else {
    return b;
  }
}

// Bloom index
var bloom_index = Switch(MCI(B04, B05, B06), FAI(B04, B06, B08));

// HighlightCompressVisualizer
// This compresses bloom index values over 0.05 corresponding to floating algae
// 0.05 will return ~ 0.9
const compressviz = new HighlightCompressVisualizer(0, 0.05);

// Visualise on color scale between 0 and 1 (after compression)
var viz = ColorRampVisualizer.createBlueRed(0, 1);

//Compressed index
compressed_index = compressviz.process(bloom_index);

return water == 0 ? trueColor : viz.process(compressed_index);Evaluate and Visualize
General description of the script
A unit-less index used to visualise high-biomass submerged and floating algae and cyanobacteria blooms in lakes.
Detects the height of the scattering peak in the Sentinel-2 bands at 705 and 740 nm after the Maximum Peak Height Algorithm (Matthews et al., 2012) used for Sentinel-3 OLCI.
Switches between the Maximum Chlorophyll Index (Gower et al., 2008) and the Floating Algal Index (Hu, 2009) approaches typically used with Sentinel-3 OLCI or MODIS.
Uses the water bodies mapping technique of Mohor Gartner. It visualises land using a simple RGB approach.
Representative Images
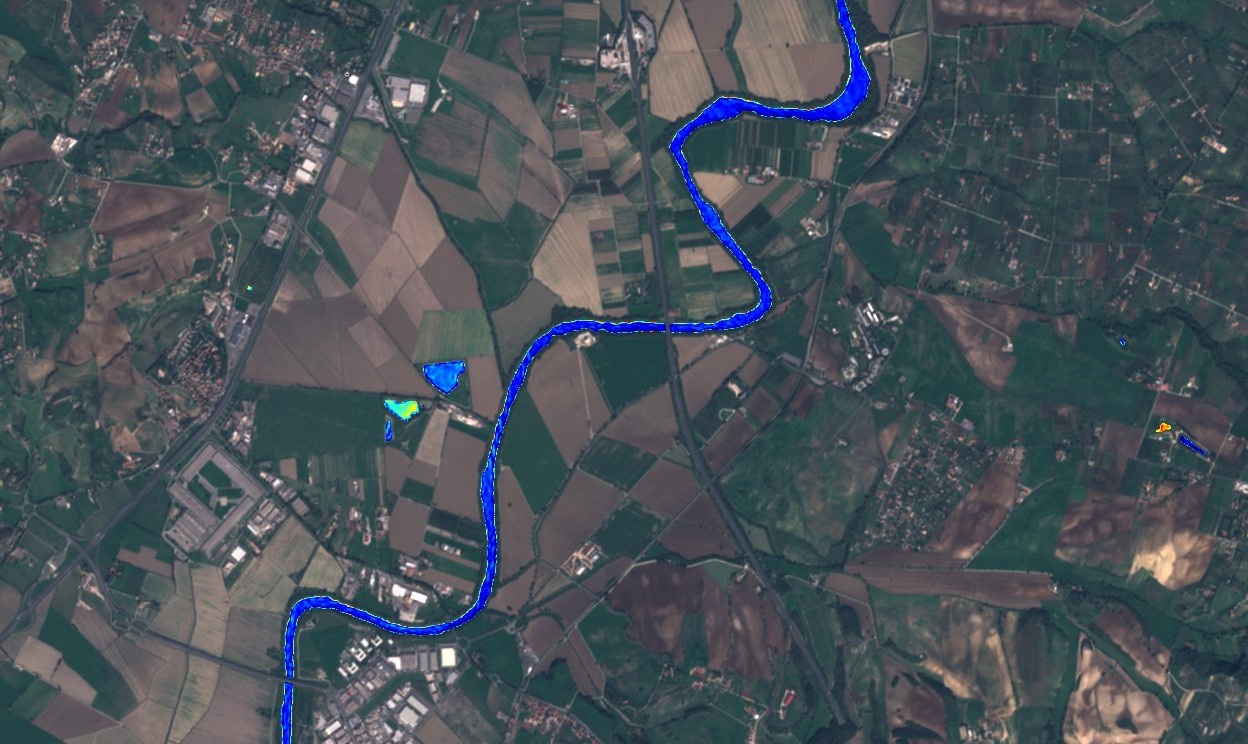
Bloom Index applied to Tevere river, Italy. Image acquired on 2017-10-08.
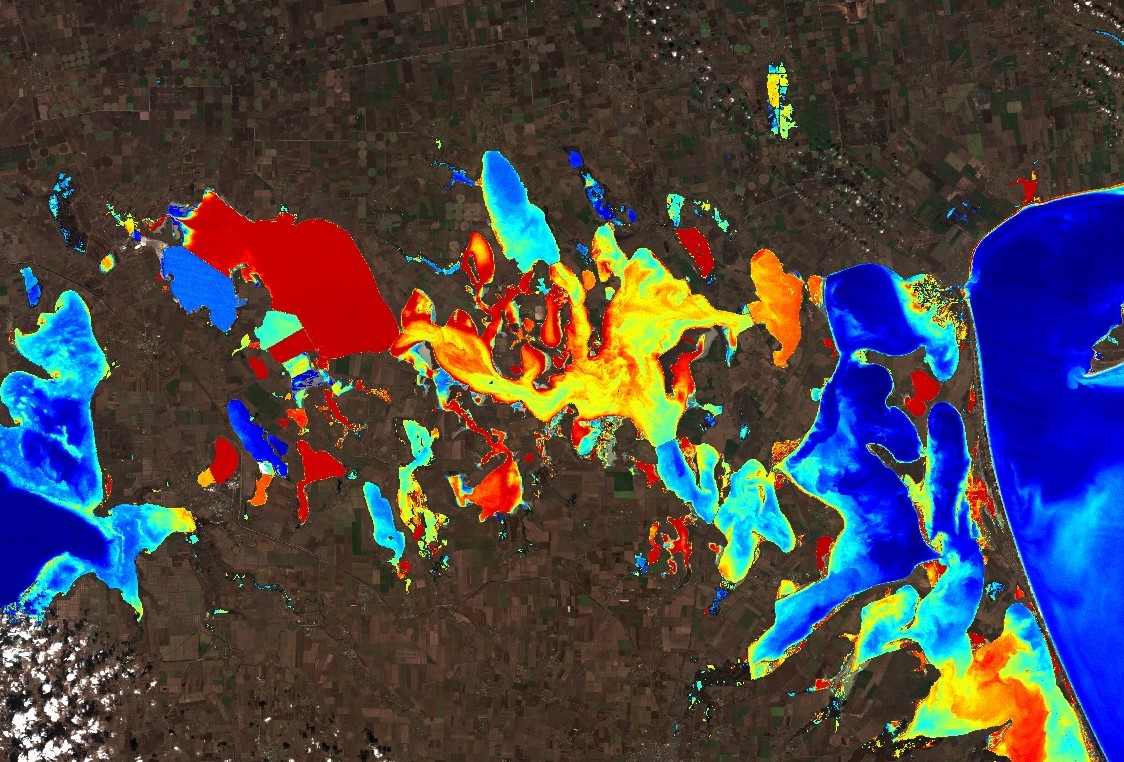
Bloom Index applied to Syvash lagoon, Ukraine. Image acquired on 2022-02-15.
Credits
Credit CyanoLakes, Jeremy Kravitz, Mark Matthews.
References
Gower, J., King, S., & Goncalves, P. (2008). Global monitoring of plankton blooms using MERIS MCI. International Journal of Remote Sensing, 29(21), 6209-6216.
Hu, C. (2009). A novel ocean color index to detect floating algae in the global oceans. Remote Sensing of Environment, 113(10), 2118-2129.
Matthews, M. W., Bernard, S., & Robertson, L. (2012). An algorithm for detecting trophic status (chlorophyll-a), cyanobacterial-dominance, surface scums and floating vegetation in inland and coastal waters. Remote Sensing of Environment, 124, 637-652.